Tutorial
- Contents
Introduction
This is a brief tutorial on how to use CITAM.
CITAM is an agent-based modeling platform that can assist in the management of indoor facilities in the context of contact-based pandemics like COVID-19 and help make policy decisions to mitigate indoor transmission risks.
This tutorial assumes that you have already downloaded and installed CITAM. For details on how to install, visit the How it Works page. To verify that CITAM has been installed properly, run the following command from your terminal:
$ citam -h
In the context of CITAM, individuals are referred to as “agents” (not the secret kind!). Before you can run simulations, you must add your facilities to CITAM (a process that we call ingestion). The ingestion process leads to a navigation-aware facility in which agents can move in a realistic fashion.
Agents can be employees, visitors or any other users of your facility. To determine how, when and where they move around in the facility, CITAM attempts to automatically create a schedule and associated itinerary for them using scheduling and meeting policies that you can provide. We will come back to those later in this tutorial. Let’s start by adding a facility.
Adding a facility
To add a facility, the most basic requirement is an SVG file that provides the spatial boundaries of each space in “path” elements. CITAM also needs information about the function of each space so it can build realistic schedules for the individuals who use them. Those information can be provided in a companion CSV file where the “id” of each space is used to match them with the SVG file.
For this tutorial, we will use example files provided with CITAM in the examples/ directory. Please download those files from GitHub if you don’t have them.
The example floorplan that we will use can be found in the examples/basic_example_2 folder located inside the main citam folder. The files that we need for now are named TF2.csv and TF2.svg Fig. 1 shows how the floor plan given by TF2.svg looks like. You can use any SVG viewer to visualize it (any web browser will do).
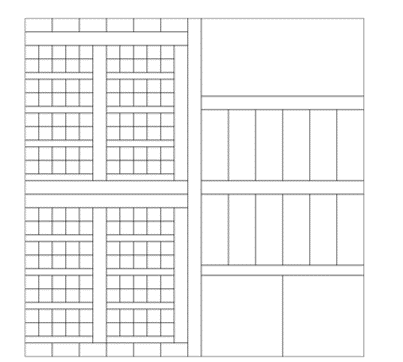
Fig. 1: Layout of the floorplan used in this tutorial. Notice how the boundaries for each space are clearly shown.
Before ingestion, let’s take a look at the content of TF2.svg. Use a text editor such as notepad++ to open the file and inspect its contents. Here is the top 30 lines of this file:
 1<?xml version="1.0" encoding="UTF-8" standalone="no"?>
 2<svg
 3	xmlns:rdf="http://www.w3.org/1999/02/22-rdf-syntax-ns#"
 4	xmlns:svg="http://www.w3.org/2000/svg"
 5	xmlns="http://www.w3.org/2000/svg"
 6	id="svg224"
 7	viewBox="-120.6 -120.6 1441.2 1441.2"
 8	version="1.1"
 9	height="600px"
10	>
11	<defs id="defs228"/>
12	<path id="1" d="M 0,1152 L 96,1152  L 96,1200  L 0,1200 z"/>
13	<path id="2" d="M 0,0 L 96,0  L 96,48  L 0,48 z"/>
14	<path id="3" d="M 96,1152 L 192,1152  L 192,1200  L 96,1200 z"/>
15	<path id="4" d="M 96,0 L 192,0  L 192,48  L 96,48 z"/>
16	<path id="5" d="M 192,1152 L 288,1152  L 288,1200  L 192,1200 z"/>
17	<path id="6" d="M 192,0 L 288,0  L 288,48  L 192,48 z"/>
18	<path id="7" d="M 288,1152 L 384,1152  L 384,1200  L 288,1200 z"/>
19	<path id="8" d="M 288,0 L 384,0  L 384,48  L 288,48 z"/>
20	<path id="9" d="M 384,1152 L 480,1152  L 480,1200  L 384,1200 z"/>
21	<path id="10" d="M 384,0 L 480,0  L 480,48  L 384,48 z"/>
22	<path id="11" d="M 480,1152 L 576,1152  L 576,1200  L 480,1200 z"/>
23	<path id="12" d="M 480,0 L 576,0  L 576,48  L 480,48 z"/>
24	<path id="13" d="M 0,1128 L 240,1128  L 240,1152  L 0,1152 z"/>
25	<path id="14" d="M 0,1080 L 48,1080  L 48,1128  L 0,1128 z"/>
26	<path id="15" d="M 0,1032 L 48,1032  L 48,1080  L 0,1080 z"/>
27	<path id="16" d="M 48,1080 L 96,1080  L 96,1128  L 48,1128 z"/>
28	<path id="17" d="M 48,1032 L 96,1032  L 96,1080  L 48,1080 z"/>
29	<path id="18" d="M 96,1080 L 144,1080  L 144,1128  L 96,1128 z"/>
30	<path id="19" d="M 96,1032 L 144,1032  L 144,1080  L 96,1080 z"/>
If you are not familiar with SVG files, there is a brief tutorial on the W3 Schools website to get you started. The file contains a list of spaces with a geometric description of their boundaries in the “d” sub element. Each space also has a (unique) ID used to identify them.
For a detailed discussion of the SVG format and the required information, please visit: Facility Data Requirements
The second file of interest in TF2.csv. Let’s take a closer look at it:
 1ID,facility,Building,Floor,unique_name,space_function
 21,TF,TF1,0,ROOM_1,Office
 32,TF,TF1,0,ROOM2,Office
 43,TF,TF1,0,ROOM_3,Office
 54,TF,TF1,0,ROOM4,Office
 65,TF,TF1,0,ROOM_5,Office
 76,TF,TF1,0,ROOM6,Office
 87,TF,TF1,0,ROOM_7,Office
 98,TF,TF1,0,ROOM8,Office
109,TF,TF1,0,ROOM_9,Office
1110,TF,TF1,0,ROOM10,Office
1211,TF,TF1,0,ROOM_11,Office
1312,TF,TF1,0,ROOM12,Office
1413,TF,TF1,0,AISLE13,Circulation
1514,TF,TF1,0,ROOM14,Office
1615,TF,TF1,0,ROOM15,Office
1716,TF,TF1,0,ROOM16,Office
1817,TF,TF1,0,ROOM17,Office
1918,TF,TF1,0,ROOM18,Office
2019,TF,TF1,0,ROOM19,Office
2120,TF,TF1,0,ROOM20,Office
2221,TF,TF1,0,ROOM21,Office
2322,TF,TF1,0,ROOM22,Office
2423,TF,TF1,0,ROOM23,Office
2524,TF,TF1,0,AISLE24,Circulation
2625,TF,TF1,0,ROOM25,Office
2726,TF,TF1,0,ROOM26,Office
2827,TF,TF1,0,ROOM27,Office
2928,TF,TF1,0,ROOM28,Office
3029,TF,TF1,0,ROOM29,Office
As you can see, this file simply contains additional information about each space as identified by their ID. For example, we can see that space ID “1” is an office on floor “0”. For a list of supported values and metadata please go to the Facility Data Requirements page of the documentation. The ID field is read as a string. The only requirement is that it is unique. The space information provided in the CSV file can also be added to the SVG file (supported soon).
Now that we know what’s in those two input files, let’s ingest this floor plan using the citam engine ingest command as follow (from the
main citam directory):
$ citam engine ingest TF2 0 --csv examples/basic_examples/TF2.csv --svg examples/basic_example/TF2.svg -v
TF2 is the name of the facility under which this floorplan will be saved and 0 is the name of this floor. For all subsequent operations on this facility, the same facility name must be provided. Alternatively, you may use:
The -v argument is for verbose, to show more information as the ingestion process progresses.
After successful ingestion, you can export the ingested floorplans as an SVG file for inspection and validation.
This step is important because in the next step, you will build the navigation network (navnet) which can be a fairly expensive
process (it takes a few hours for large facilities) depending on the size of your facility. You definitely want to make sure the ingested facility looks good before building the navnet so
you don’t have to repeat that step.
Let’s export the ingested floorplan into a file named TF2_ingested.svg,
you can use the citam engine export-floorplan command as follow:
$ citam engine export-floorplan TF2 0 -o TF2_ingested.svg -v
Use any SVG viewer (such as your favorite web browser) to visualize the exported file. Fig. 2 shows what the ingested floor plan looks like. CITAM has removed walls that it thinks are unnecessary (based on whether they fall between two hallways). CITAM has also added doors to each space.
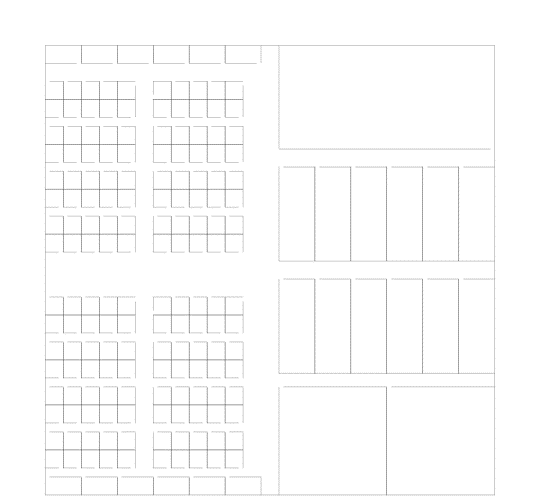
Fig. 2: The ingestion process will remove walls that are between hallways and add doors to all other spaces.
As you can see, the TF2 facility does not have an entrance and some valid walls have been mistakenly removed. The good news, is that you can edit the SVG file to add the walls and doors that are missing. For that, you will need an SVG editor such Inkscape (free and open-source). These are the actions permitted:
Add a wall: To add a wall, you just need to draw a straight line where it should be.
Delete a wall: To delete an existing wall, simply delete the corresponding line in the drawing.
Modify a Wall: To modify a wall (make it shorter, or longer, or change its position), just manipulate the corresponding line in the drawing accordingly.
Add a door: To add a new door, you need to draw a line where desired, but you must assign an ID that contains the keyword “door” to it. Note that you can draw a door line on top of an existing wall line. CITAM will know to carve out the door from the wall.
Remove a door: To remove a door, you have to extend an existing wall or create a new wall to completely cover the door opening.
An example of the floor plan after using Inkscape to include wall features is as shown in Fig. 3.
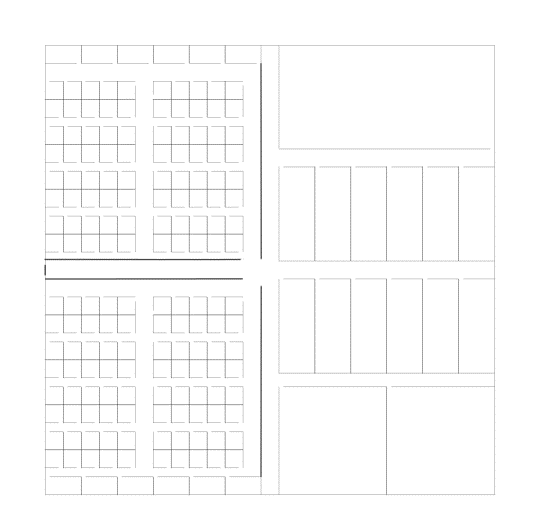
Fig. 3: Floorplan as edited in Inkscape. The newly added lines are darker. Notice how a door is added to the left outside wall as a regular line except its ID is set to “door_1”.
Save your edited svg file as “TF2_edited.svg”. Now update it within CITAM using the citam engine update-floorplan command as follow (assuming ):
$ citam engine update-floorplan TF2 0 -s ../../TF2_edited.svg -v
To verify that the floorplan looks good, you can export it again using the export-floorplan command:
$ citam engine export-floorplan TF2 0 -o TF2_updated.svg -v
You can edit and re-update the floorplan as many times as needed until you are happy with it.
Congratulations! You have ingested your first floorplan. This is the most involved step in the process but you only have to do it once for each floor of your facility. Once you are happy with the floorplan, the next step is to generate the navigation network.
Running a simulation
To run a simulation, you need an input file in JSON format. Please create a new folder to run the simulation. We will refer to this folder as SIMULATION_FOLDER. Now open your favorite text editor and create a new file called sim_inputs.json inside SIMULATION_FOLDER.
Below is an example input file.
{
    "facility_name" : "TF2",
    "simulation_name" : "test_sim_2",
    "run_name": "run_1",
    "floors" : ["0"],
    "entrances" : [ {"name":"AISLE213", "floor": 0}],
    "daylength" : 1800,
    "entrance_time" : 100,
    "n_agents" : 20,
    "occupancy_rate" : null,
    "floorplan_scale": 0.08333333333,
    "contact_distance": 6,
    "shifts": [{"name":"1", "start_time": 0, "percent_agents": 1.0}]
}
A detailed description of the input parameters can be found in Simulation Input Requirements.
Copy and paste the contents above in your input file, then save and close the file.
Now navigate to your SIMULATION_FOLDER and start a new simulation using:
$ citam engine run sim_inputs.json
Sit back and relax as your simulation runs. Soon you will have results to analyze.
After less than one minute, the simulation should be completed and you should have the following files created in your SIMULATION_FOLDER:
SIMULATION_FOLDER
├── floor_0
│   ├── contact_dist_per_coord.csv
│   |── contacts.txt
|   |── map.svg
│   └── heatmap.svg
├── citam.log
├── contact_dist_per_agent.csv
├── employee_ids.txt
├── simulation.json
├── manifest.json
├── pair_contacts.csv
|── raw_contact_data.ccd
|── timing.txt
└── trajectory.txt
Congratulations, you successfully ran your first simulation!
For a description of all the output files, go to: Output Description
For details on how to visualize and interpret your results go to: Visualize Results
Exploring Policies
Coming soon